Climate Impacts
- There is a wide range of sectors considered in climate impact research including impacts related to agriculture, energy, and health.
- Climate impact models use data from climate and socioeconomic scenarios to create impact scenarios.
Chapter Summary
Climate impacts are consequences and effects of climate change on nature and society. These may include changed agricultural yields, increased floods, and droughts, or coral reef bleaching due to changes in the chemical composition of the ocean.
The Inter-Sectoral Impact Model Intercomparison Project →ISIMIP plays an important role in climate-impact research by faciliting consistent impact simulations across various sectors and collecting and disseminating the results.
Agriculture
The agriculture sector in ISIMIP seeks to understand how crops will be affected by changing atmospheric composition and climate. Increasing carbon dioxide concentrations may help some crops perform better, and in some regions increased temperatures could extend the growing season. But in other regions, more frequent and more intense heat waves and droughts could harm crop yields. This sector also examines how changing management practices (crop varieties, fertiliser, and irrigation) could be used to counteract negative effects of climate change.
Biodiversity
The ISIMIP Terrestrial Biodiversity Sector investigates the potential future impacts of climate and land-use change on global terrestrial biodiversity. We compare projected impacts under different emission scenarios as well as for different modelling approaches to understand and predict how the diversity of animals and plants in the terrestrial biosphere is influenced by multiple anthropogenic threats.
Biomes
The Global Biomes Sector studies how climate and land-use change will affect the distribution and functioning of natural vegetation around the globe. Especially carbon and water cycling as well as the biogeographic distribution of plants under climate change are particularly relevant for this sector. The simulations contribute to better understand the capacity of natural vegetation to sequester and store carbon under increasing pressure from climate change but also from land-use changes.
Coastal Infrastructure
The increase of damage due to coastal extreme sea-level events (from tides, mean sea level anomalies, tropical cyclones, extratropical storm surges and waves) may be one of the costliest aspects of climate change and sea-level rise. The coastal sector of ISIMIP assesses these impacts at global and continental scales in order to inform a range of policy decisions including setting global mitigation targets, designing global financial mechanisms for adaptation and loss & damage, and strategic long-term coastal adaptation planning. In order to adequately inform such decisions, we systematically consider all major uncertainties in assessments of current and future coastal risk, including climate and socioeconomic scenario uncertainty, climate model and impact uncertainty, natural internal variability, as well uncertainties methods applied for extreme value analysis.
Energy
ISIMIP Energy aims to assess all aspects of climate change impacts in the energy sector. This comprises two tracks: direct impacts on energy supply and demand and resulting impacts on the energy system as a whole. Energy supply can be affected in multiple ways, depending on the source. Potentials for renewable energy generation can change due to change in water supply (hydropower), radiation levels (solar power), wind direction and speed (wind power), agricultural yields (bioenergy) or water temperature (thermal power). Energy demand is strongly related to temperature via heating and cooling demands, which is expected to change significantly under climate change in particular through increased demand for air condition. Results derived from the first track are used as an input for energy system, economic or integrated assessment models which, under assumptions for future policy scenarios, derive the resulting composition of the future energy system as well as related costs and can also address questions of energy poverty or the cross-sectoral challenge of the water-energy-food nexus.
Forestry
The Regional Forest Sector strives to understand how climate change will affect managed forests. Currently, simulations are carried out at the forest stand level for a wide range forest types covering the main forest tree species in Europe. The simulations are designed to disentangle the effects of different management schemes, of changing CO2-concentrations and of different climate scenario on key forest services and functions such as plant productivity and growth, wood harvests and carbon and water cycling. Climate change is impacting forests in manifold ways potentially increasing productivity unless water is limited or disturbances such as fire or insect outbreaks lead to catastrophic damages.
Health
The ISIMIP health sector strives to provide improved knowledge on how human health will be affected by climate change. So far, from the myriad of potentially climate sensitive health outcomes only temperature related mortality, heat effects on labour productivity, and geographic changes in malaria suitability, have been considered in past modelling activities. For more comprehensive assessments of the health impacts of climate change extensions are planned to include (water-borne) infectious diseases and nutritional defects arising from food shortages. Modelling covers a wide range of spatial scales from local approaches (e.g., specific cities) to global assessments.
Lakes
Analyses in the ISIMIP lake sector currently focus on how climate change is affecting the physical properties of lake functioning. Lake sector simulations follow two synergetic tracks, whereby one-dimensional lake models are either (i) tailored to reproduce observed processes in a selection of around 50 well-studied lakes, or (ii) run across all lake regions of the globe with one consistent set-up. The resulting data set provides an unprecedented opportunity to assess lake model performance and uncover global warming impacts on e.g., thermal stratification or lake ice dynamics, thereby forming the basis for understanding how lacustrine systems will respond to anthropogenic climate change.
Marine Fishery (FishMIP)
FishMIP looks at the future of marine ecosystems, and consequences for fisheries, biodiversity, and food supply. Climate change impacts the oceans in many ways, such as warming, ocean acidification, and deoxygenation, and we have a range of models to explore these issues with. The oceans provide many services to human beings, and the health and productivity of marine ecosystems remains of critical importance. Marine ecosystem models are extremely varied, so FishMIP allows us to look at these questions and make projections from many different angles.
Permafrost
Permafrost is defined as material that remains frozen for two consecutive years. Climate warming, which is amplified in the polar regions, can induce environmental changes that accelerate microbial breakdown of organic carbon that has previously been locked in the permafrost. The magnitude and timing of greenhouse gas emissions from thawing permafrost remain, however, highly uncertain. Thawing of permafrost affects ecosystems and climate on various spatial and temporal scales ranging from local to regional topography, hydrology, and biology as well as global scale biogeochemical cycling. Thawing of permafrost is also of high social (indigenous culture) and economical relevance (infrastructure, particularly oil and gas development).
Tropical Cyclones
The tropical cyclone sector in ISIMIP studies the change in global tropical cyclone activity and the corresponding impacts on society. This sector analyses how spatio-temporal patterns of tropical cyclone occurrence may change with climate change and, in particular, looks at changes in tropical cyclone intensity as well as frequency. Impacted societies do not only suffer from destructive winds but also from many other co-hazards like extreme precipitation, storm surges, and sea-level rise. These co-hazards provide a direct link to other sectors within ISIMIP, e.g., the coastal infrastructure sector. The simulations in this sector can provide a climate-proof risk assessment for coastal communities and provide guidance on potential adaptation strategies.
Water (global)
The global water sector runs models to understand what water resources look like across the globe nowadays and how they might change in the future. We assess risks such as water scarcity, droughts and flooding. The models are able to account for factors such as human management of the water cycle, including dams, irrigation and water abstractions from rivers. A lot of work in this sector focuses on understanding how water-related risks might be affected by changes in future population and a changing climate. Our results show that climate change is likely to exacerbate regional and global water scarcity considerably, whilst the magnitude of flooding could increase across around a third of the global land surface.
Water (regional)
Climate change is a global phenomenon, but the impacts manifest at the regional scale, and the regional scale is also where most adaptation measures in the water sector are planned and implemented. The aim of the regional water group in ISIMIP is therefore to underpin global scale assessments with more detailed regional and cross-scale studies, where both sides learn from each other and benefit from cross-pollination of ideas and methods. Eleven large scale river basins have been selected to act as case studies to investigate climate change impacts on water resources and extremes and across sectors.
Not only temperature and precipitation are input for impact models but also socioeconomic factors are taken into account. The ISIMIP project, for example, does not only use climate change projections belonging to a certain RCP as input, but also takes up elements of SSP scenarios. A suite of climate impact models produce projections of biophysical impacts of climate change in a variety of sectors described above.
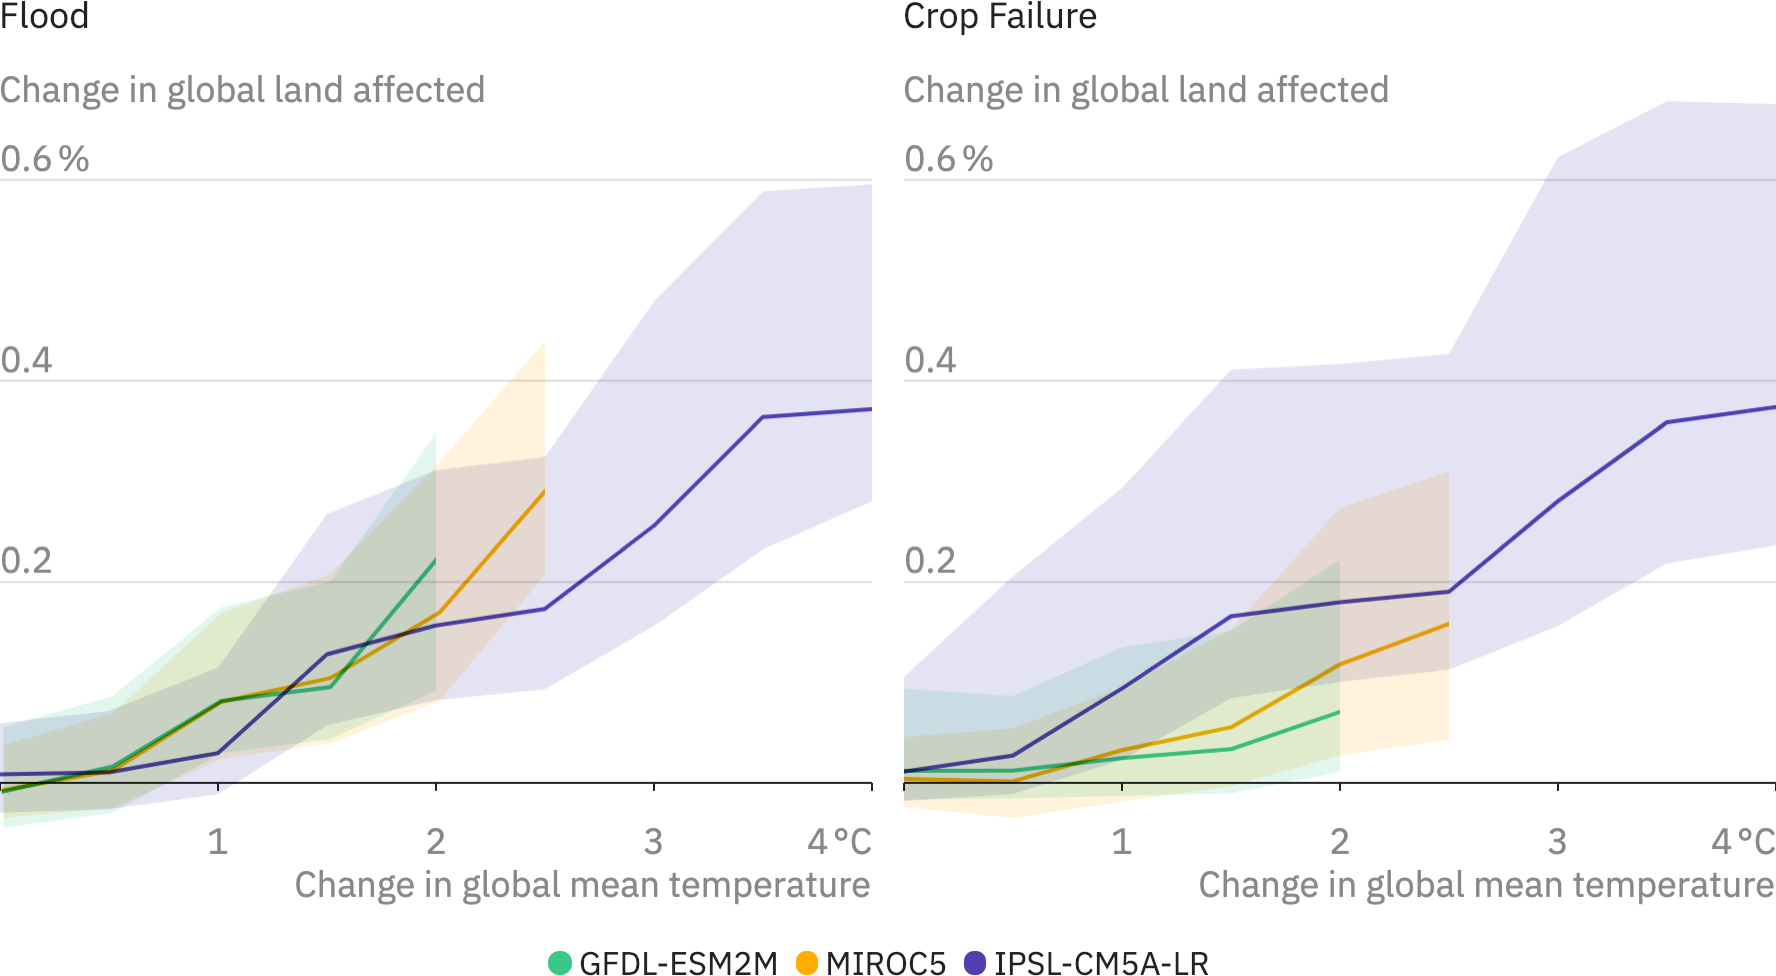
The charts above show simulation analyses of impact simulations for two sectors, floods, and crop failure. In particular, the change in the percentage of the global surface that is affected by extreme event when compared to preindustrial times, is shown. In each case, climate data from three different global climate models (GFDL-ESM2M, MIROC5, and IPSL-CM5A-LR) were used to drive the impact models – each color relates to results using data from a different climate model. The thick lines depict the median of the ensemble for all impact models considered. The shaded areas show the 20th to 80th percentile of that ensemble and thus give a feel of the model spread.