Mitigation
The Paris Agreement was a historic step in global efforts to combat climate change. Countries agreed to take action to hold global mean temperature increase well below 2 °C and pursue efforts to limit warming to 1.5 °C.
Such temperature targets can be translated to various other quantities: emissions budgets of cumulated future greenhouse gas (GHG) emissions and stabilization levels of atmospheric GHG concentrations or, equivalently, anthropogenic radiative forcing of the climate system. Since each ton of carbon dioxide emitted into the atmosphere adds extra warming lasting over hundreds of years, a temperature limit translates into a finite budget for the amount of carbon dioxide that can still be emitted into the atmosphere. Likewise, to limit the warming, greenhouse gas concentrations in the atmosphere and the associated radiative forcing need eventually to stabilize to allow the climate system to find a new equilibrium of incoming solar radiation and outgoing heat radiation from Earth.
For classifying the stringency of different warming limits the concept of Representative Concentration Pathways (RCPs) has been introduced to climate change research. Like the SSPs, they are called “Pathways” in the literature, but in fact constitute projections of greenhouse gas emissions and concentrations and their combined radiative forcing. They originally comprised four projections, ranging from RCP 2.6 to RCP 8.5, and after the adoption of the Paris Agreement were augmented by RCP 1.9 to represent mitigation pathways compatible with the 1.5 °C warming limit. The values refer to radiative forcing in Watt/m2 by the end of the century compared to preindustrial times, e.g. 2.6 Watt/m2 in the case of RCP 2.6. For comparison, a doubling of atmospheric CO2 concentration from preindustrial times, i.e. from ca. 280 parts per million (ppm) air molecules to 560 ppm, would amount to a radiative forcing of 3.7 Watt/m2. In 2016, CO2 concentrations reached 400 ppm, and the radiative forcing from all anthropogenic influences on the climate system was estimated to amount to ca. 2.3±1 Watt/m2 in 2011.
| RCP | Forcing | Temperature | Emission Trend |
|---|---|---|---|
| 1.9 | 1.9 W/m2 | ~1.5 °C | Very Strongly Declining Emissions |
| 2.6 | 2.6 W/m2 | ~2.0 °C | Strongly Declining Emissions |
| 4.5 | 4.5 W/m2 | ~2.4 °C | Slowly Declining Emissions |
| 6.0 | 6.0 W/m2 | ~2.8 °C | Stabilising Emissions |
| 8.5 | 8.5 W/m2 | ~4.3 °C | Rising Emissions |
The relevant radiative forcing levels for the Paris Agreement are 2.6 W/m2 leading to warming of well below 2 °C and 1.9 W/m2 limiting warming to 1.5 °C or below. This is captured by RCP 2.6 and RCP 1.9.
The RCPs can be combined with the SSPs to derive emissions and concentration scenarios that take up the socioeconomic assumptions underlying the SSPs and then impose climate policies to reach the end of century radiative forcing levels as defined by the RCPs. Hence, the SSPs and RCPs can be arranged into a matrix of climate forcing outcomes (in the rows) and socioeconomic development assumptions (in the columns). This scenario matrix architecture provides a powerful tool to explore the space of response options to to climate change. The scenarios and pathways populating the individual cells are called SSP x–y (x = SSP number; y = radiative forcing level) in the literature. This also allows to distinguish them from the original RCPs that were used to drive climate change projections in the fifth Climate Model Intercomparison Project (CMIP5). Those original RCPs did not derive from the SSPs, as the SSPs were only developed a few years later. However, the emissions and forcing projections to drive the next round of climate change projections, CMIP6, will use the new SSP-based scenarios, e.g. SSP 1–2.6 rather than the original RCP 2.6.
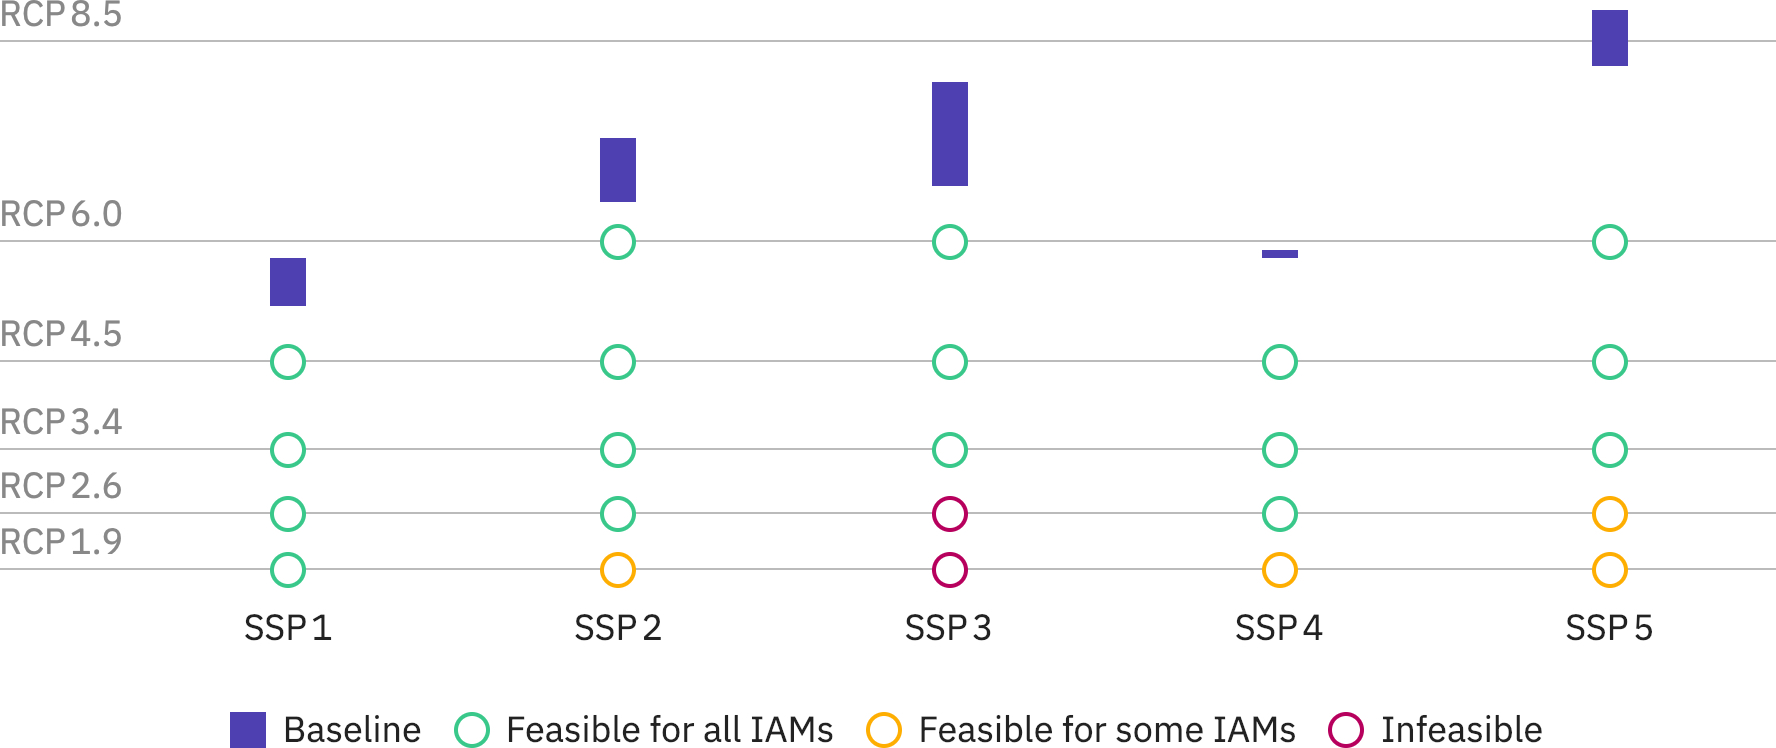
This scenario framework allows to explore climate change mitigation policies and their impact on energy use, land use, emissions, and economic activity relative to the baseline scenario without climate policies, to mitigation pathways with different levels of stringency (comparison across rows), and to mitigation pathways with the same level of stringency, but different socio-economic assumptions (comparison across columns). Naturally not every combination of SSPs and RCPs is feasible, e.g., SSP 3 with a radiative forcing of 1.9 and 2.6 W/m2 has been found infeasible in IAMs due to regional rivalry impeding global coordination of deep mitigation efforts.
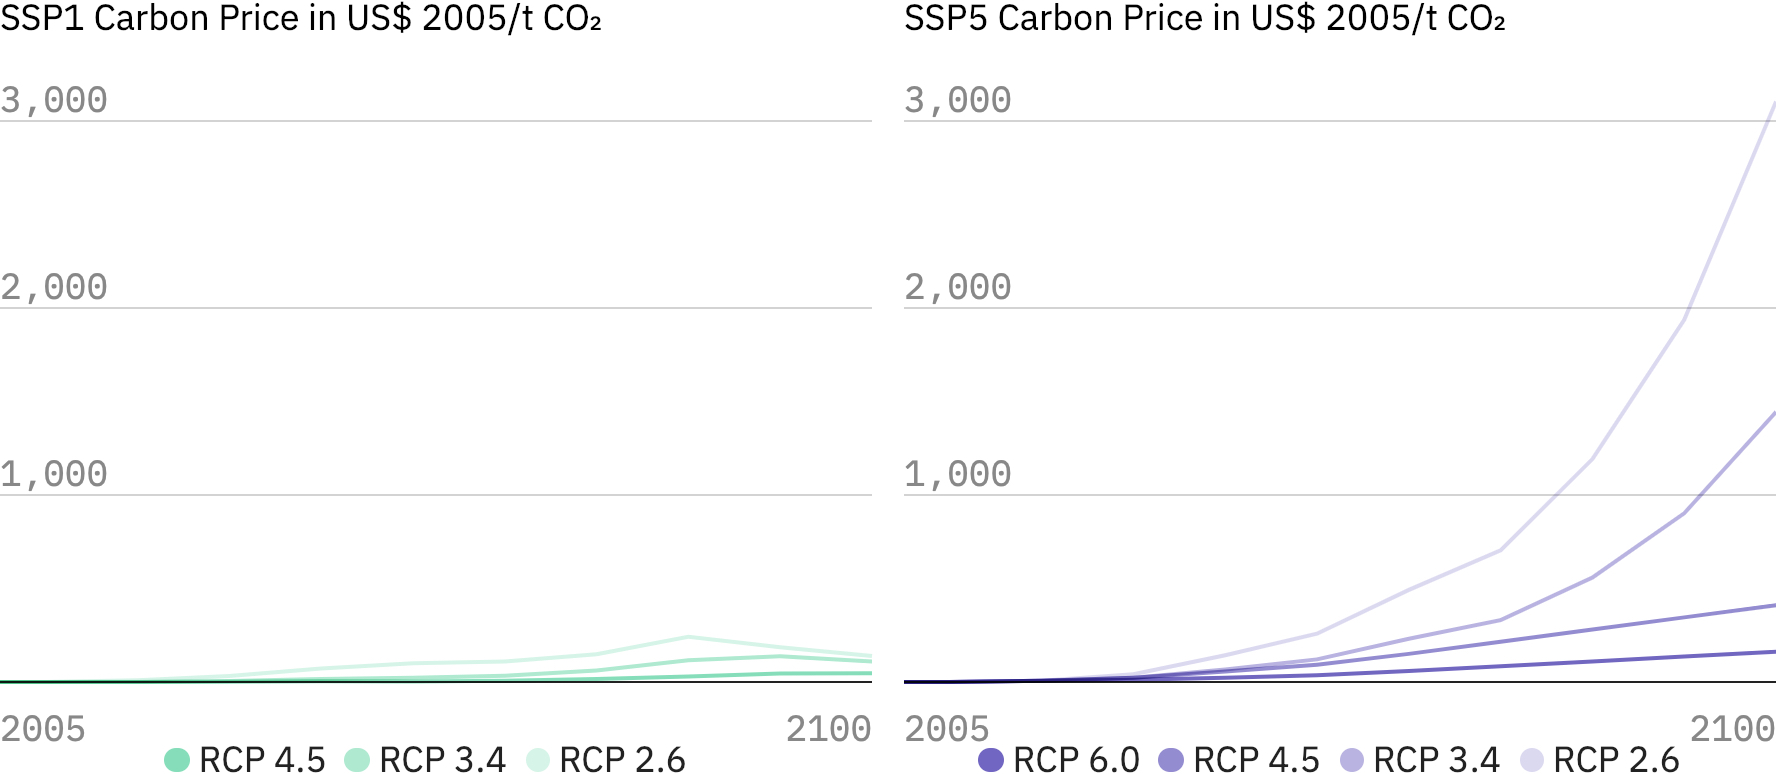
The emissions price that IAMs need to impose to reach the mitigation levels of the RCPs reflects by and large the cost of the most expensive ton of emissions reduction (called marginal abatement cost in economic jargon). As shown above, the emissions price not only increases with increasing mitigation stringency, but also varies substantially with different socioeconomic developments across the SSPs. The lower the socioeconomic challenges to mitigation, the lower the carbon price for the same mitigation goal.
Mitigation scenarios in the literature are varied along more dimensions than just the SSPs and RCP forcing levels. For example, they have been used to look at the individual role of technologies and sectors for mitigating climate change by changing technology availability or technology costs in terms of a sensitivity analysis (limited technology scenarios). Others have looked at different near term climate policy developments with different levels of delay and regional variation compared to stringent global action pathways (delay scenarios). These are particularly relevant for informing the implementation of the Paris Agreement, which aims to coordinate nationally determined contributions (NDCs) to climate action so to reach the long term climate goals. The first set of NDCs were specified for 2030, and thus mitigation scenarios that go through the NDCs in 2030 have become available in recent years.
Summary
- Representative Concentration Pathways (RCPs) represent different emissions, concentration and radiative forcing projections leading to a large range of global warming levels, from continued warming rising above 4 °C by the year 2100 to limiting warming well below 2 °C as called for in the Paris Agreement.
- When combined with the Socioeconomic Pathways (SSPs) they provide a powerful framework to explore the space of future mitigation pathways in terms of different levels of mitigation stringency and different assumptions about socioeconomic development.
- The mitigation pathway literature developed by the application of integrated assessment modelling comprises a wide variety of mitigation pathways, including pathways with limited technology availability and delays in climate policy in addition to variations in mitigation targets and socioeconomic drivers.
Further reading
- IPCC Special Report on Global Warming of 1.5°C, Chapter 3
- Van Vuuren, D. P., Kriegler, E., O’Neill, B. C., et al. (2014). A new scenario framework for climate change research: scenario matrix architecture. Climatic Change, 122(3), 373-386.
- Van Vuuren, D. P., Edmonds, J., Kainuma, M., et al. (2011). The representative concentration pathways: an overview. Climatic change, 109(1-2), 5.
- Clarke, L., Jiang, K., Akimoto, K., et al. (2014). Chapter 6 - Assessing transformation pathways. In Climate Change 2014: Mitigation of Climate Change. IPCC Working Group III Contribution to AR5. Cambridge University Press.